Question
How can market movement across many cryptocurrencies be summarized without losing the ability to inspect individual assets?
Context
Why this mattered
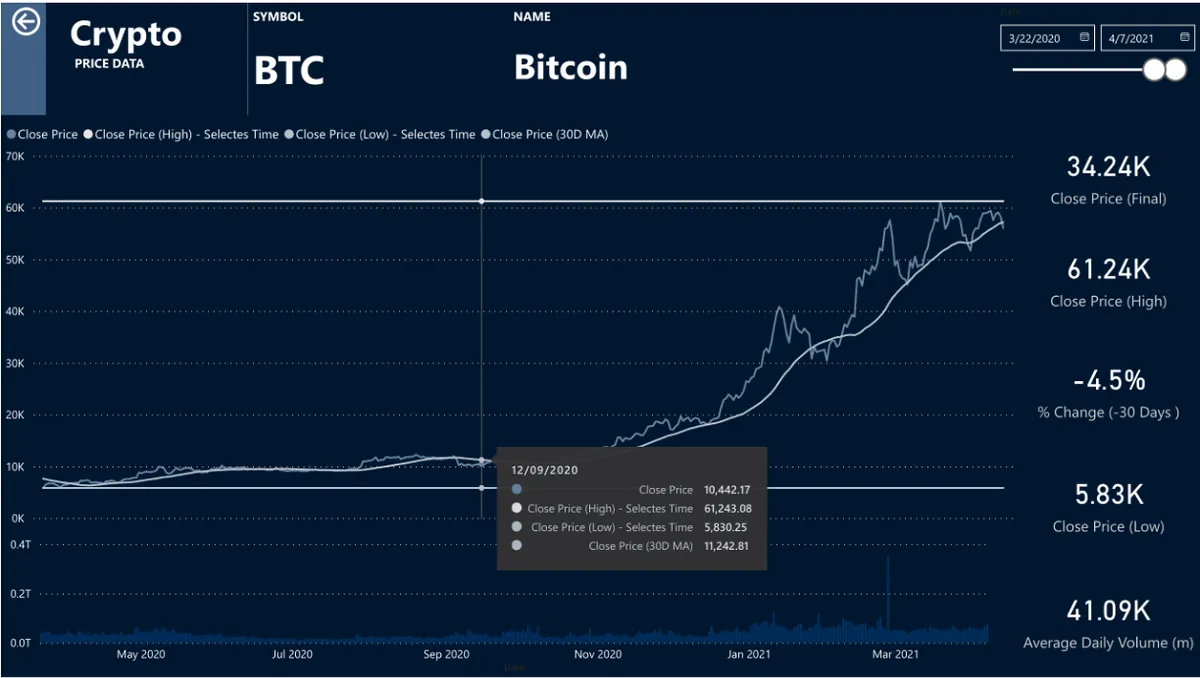
A dashboard project covering 50 cryptocurrencies and a set of market measures including period change and trading-volume views.
Approach
From ambiguity to evidence
Structured cryptocurrency market data for repeatable comparison across assets and time periods.
Defined measures for year-over-year, month-over-month, percentage change, and average daily volume.
Designed Power BI views that balance market-level scanning with asset-level detail.
Findings
What the analysis surfaced
Consistent measures make cross-asset movement easier to compare.
Separating price change from volume context produces a more useful market view.
The dashboard supports historical exploration and is not investment advice.
Contribution
What I owned
Data analyst and Power BI dashboard designer.