Question
Where do shoppers drop out of the clickstream funnel, and which behaviors distinguish browsing from purchase paths?
Context
Why this mattered
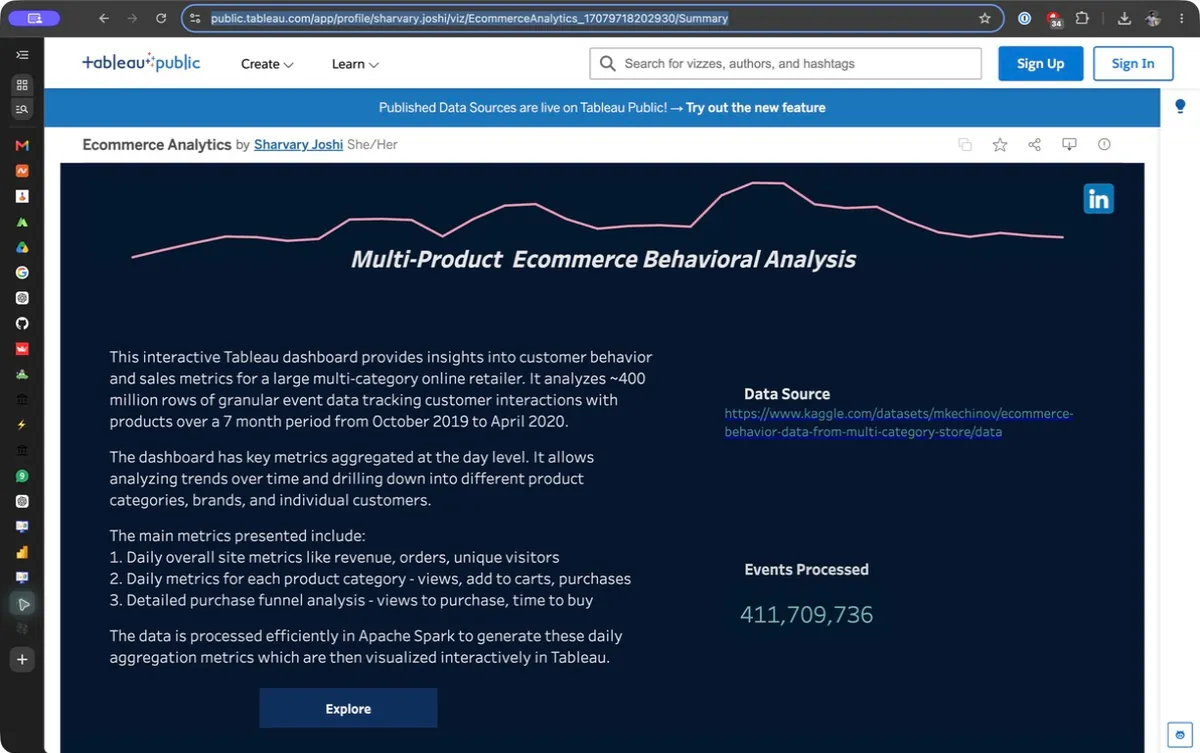
Public Kaggle e-commerce event data analyzed as a large-scale funnel rather than customer-level proprietary data.
Approach
From ambiguity to evidence
Processed the public event set with Spark to prepare event and funnel aggregates.
Defined browse-to-cart-to-purchase stages and compared behavior across them.
Published the resulting views in Tableau for interactive path and conversion analysis.
Findings
What the analysis surfaced
The funnel view makes stage-level drop-off and purchase-path differences easy to inspect.
Event-level behavior provides directional insight but does not identify individual customer intent.
Combining Spark preparation with Tableau exploration keeps the large dataset usable for business review.
Contribution
What I owned
Analytics engineer and Tableau dashboard designer.