Question
How can operational and environmental data be brought together to compare data-center sustainability performance?
Context
Why this mattered
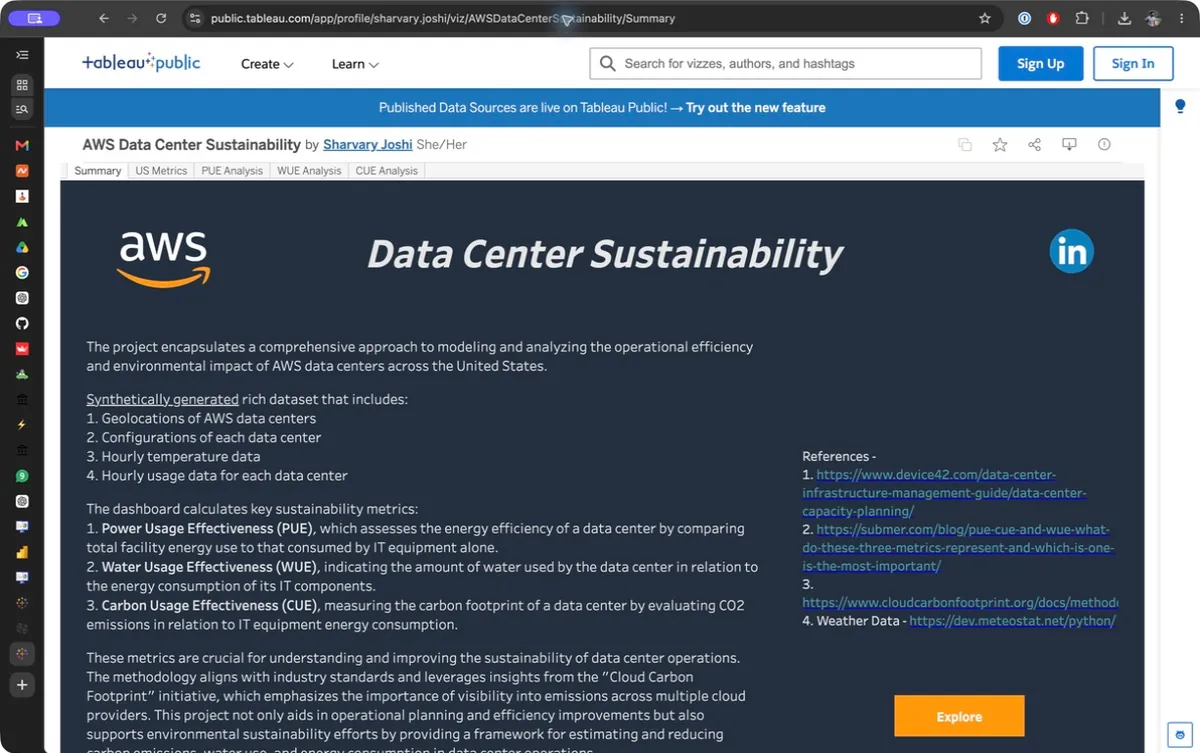
An analytics project combining public and synthesized data for U.S. data-center locations, configurations, temperatures, and hourly utilization.
Approach
From ambiguity to evidence
Prepared a unified analytical dataset across location, configuration, temperature, and utilization inputs.
Modeled PUE, WUE, and CUE as comparable sustainability and efficiency measures.
Designed an interactive Tableau experience for moving from portfolio summary to site-level patterns.
Findings
What the analysis surfaced
A shared metric layer makes operational and sustainability comparisons easier to interpret.
Utilization and environmental context are important when reading efficiency measures across sites.
The dashboard is an analytical comparison tool built from project data, not an assessment of AWS operations.
Contribution
What I owned
Data analyst and Tableau dashboard designer.